Nick Bostrom has a very interesting paper called “Existential Risk Prevention as Global Priority.” The basic intuition is that preventing even small risks of human extinction is worthwhile if we consider all the human generations it would save.Existential Risk Prevention as Global Priority
Meteor events have varying degrees of impact on the earth. While small meteoroids and asteroids frequently scrape the earth's atmosphere with little to no consequences, major impact events caused by large astronomical objects, despite their rarity, can significantly shape the tracks of lives on earth.
Meteorite "Falls" vs. "Finds"
Finds are meteorites which were found on the ground unrelated to any sighting, due to the finder recognizing them to be clearly identifiable as being of nonterritorial origin. Falls are meteorites which were seen to fall from the sky and which were tracked down successfully.To date, there have been nearly 1,100 recovered falls (meteorites seen to fall) and nearly 40,000 finds (found, but not seen to fall). It is estimated that probably 500 meteorites reach the surface of the Earth each year, but less than 10 are recovered. This is because most fall into the ocean, land in remote areas of the Earth, land in places that are not easily accessible, or are just not seen to fall (fall during the day).
How frequent do meteorite falls occur each year?
Our best estimates of the total incoming meteoroid flux indicate that about 10 to 50 meteorite dropping events occur over the earth each day. It should be remembered, however, that 2/3 of these events will occur over ocean, while another 1/4 or so will occur over very uninhabited land areas, leaving only about 2 to 12 events each day with the potential for discovery by people. Half of these again occur on the night side of the earth, with even less chance of being noticed.
How many meteors can I expect to see if I go out to observe for them, when no meteor shower is occurring?
The number of random, or “sporadic” meteors that can be seen in the night sky is quite variable, depending upon such factors as the time of night, time of year, light pollution, and cloud conditions. Perhaps the most important factors necessary in order to observe meteors are to have a clear, unobstructed view, out in the open, and under as dark sky conditions as possible.
We can’t see or track them down due to poor atmospheric clarity, or they are more likely been burned up due to thicker cloud conditions.amsmeteors.org
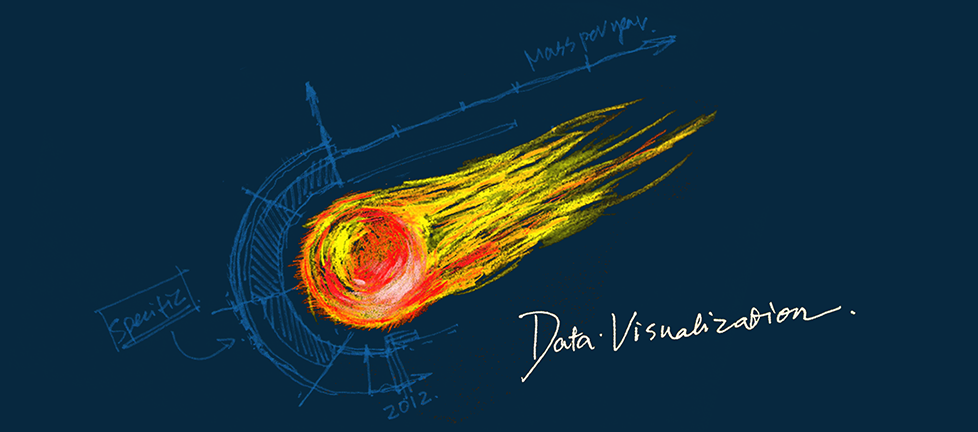
Storytelling
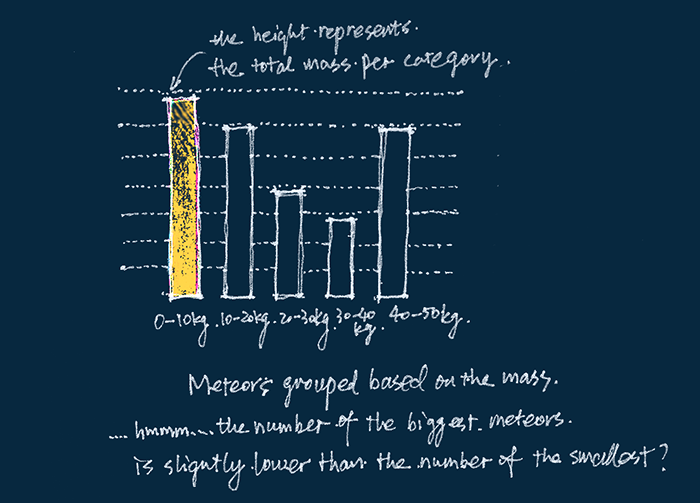
Visualizations presented with this work were created using the Meteorological society dataset. After publishing the dataset, the society produced the visualization of their own, created in Tableau. The Tableau solution served as a quick overview and inspiration for some of the first sketches of ours. Looking at it, we observed a first pattern - a meteorite mass per year presented with a simple bar-chart:
While sketching the bar charts, we accidentally smudged them and noticed with surprise that the shape resembles the bright tail of a meteor. We then proceeded to replicate this effect with more bar charts. We started deleting lines, changing the positions, and introducing new colors. All the steps were hand-sketched and that transfered into the Photoshop.
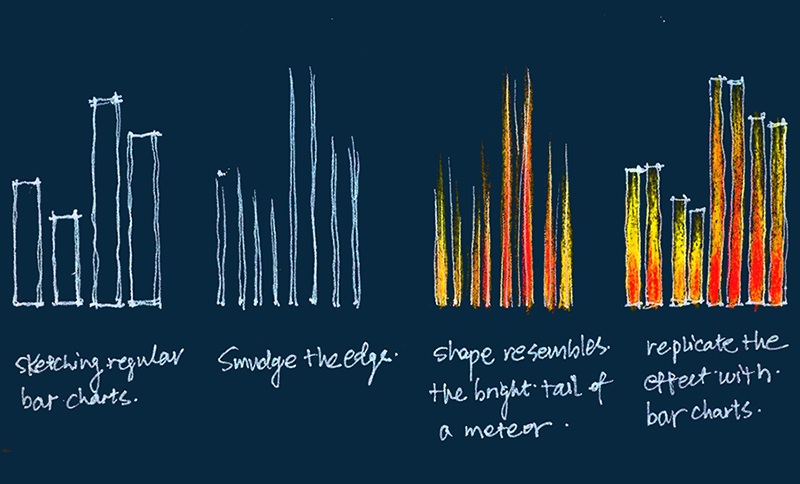
Considering that the bar charts only represent partial geometry of a flying meteor, we experimented with a variety of plotting schemes hoping to visualize the data in the shape of a whole meteor.
Our thought process is portrayed in the figure below. The width and height of a bar represent a time span and a certain meteor parameter, respectively. The bar chart can be morphed into a semi-circle donut chart with close resemblance to the meteor body. Used in tandem, the bar chart and donut chart together can carry more information: an arc and a width segment connected by a dotted line correspond to the same time span, whereas their orange bars are a measure of two different or correlated meteor parameters.
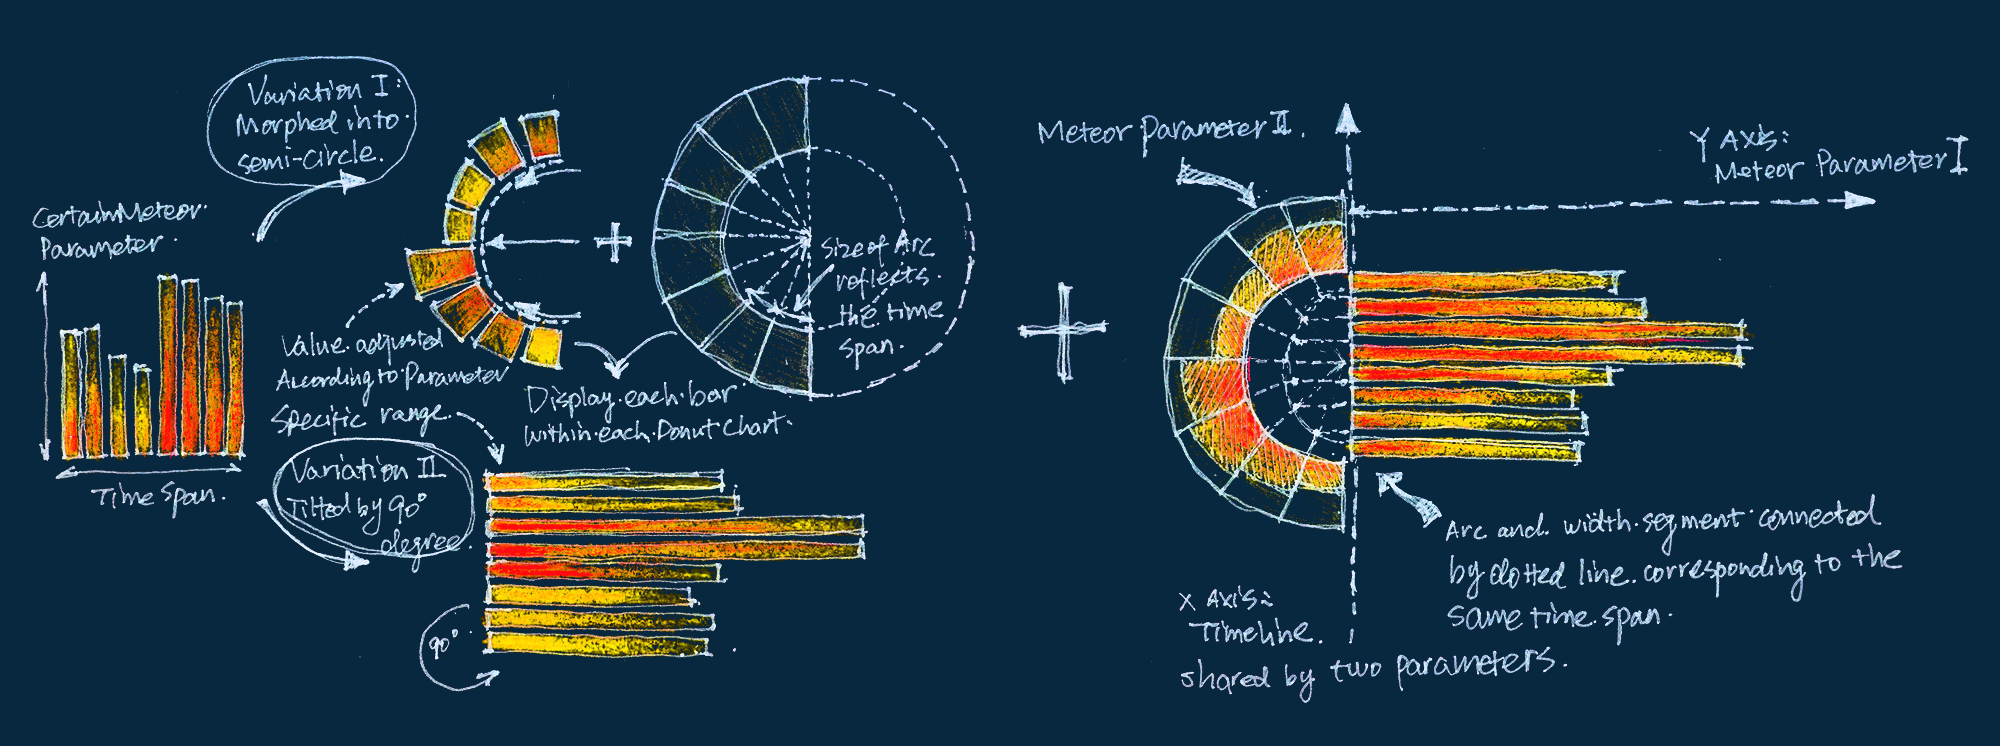
The final sketch is shown in the figure below, where on the donut chart the ratio of the height of the shaded orange bar to the whole bar indicates the meteor fallen percentage, and on the bar chart the height of the bar describes the magnitude of total mass per year. One minor change in the final sketch is that within a single time span, there are multiple data on the bar chart that visualize the data of total mass per year on a finer scale.
How to read?
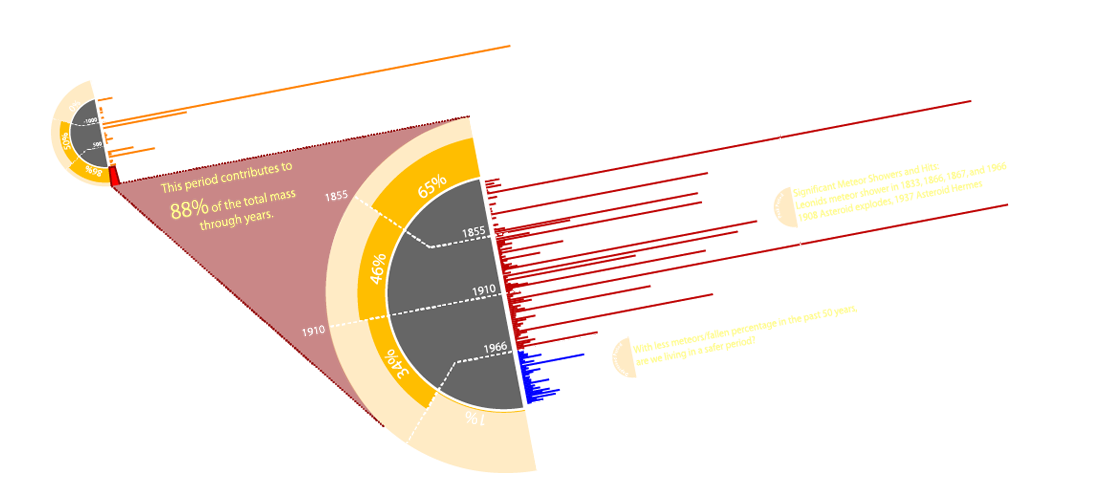
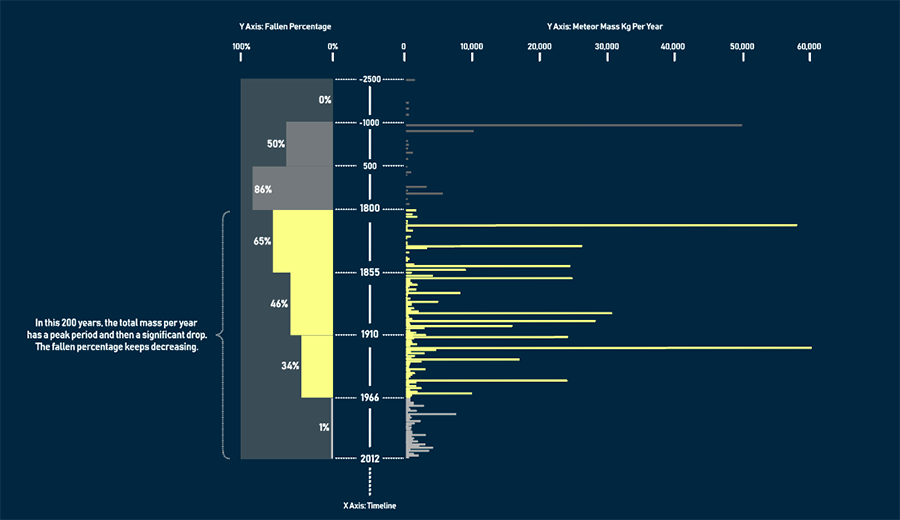
The data presents the meteor impact on Earth from 2500 BCE to 2012. Two parameters were displayed in the legend below, adopting the model we invented during the sketch phase:
- The total mass per year. A bar chart was constructed in Tableau using year as filter, showing the sum of mass for each year.
- The amount ratio that were seen and were tracked down successfully: Fallen Percentage = Falls/(Falls + Finds)*100%

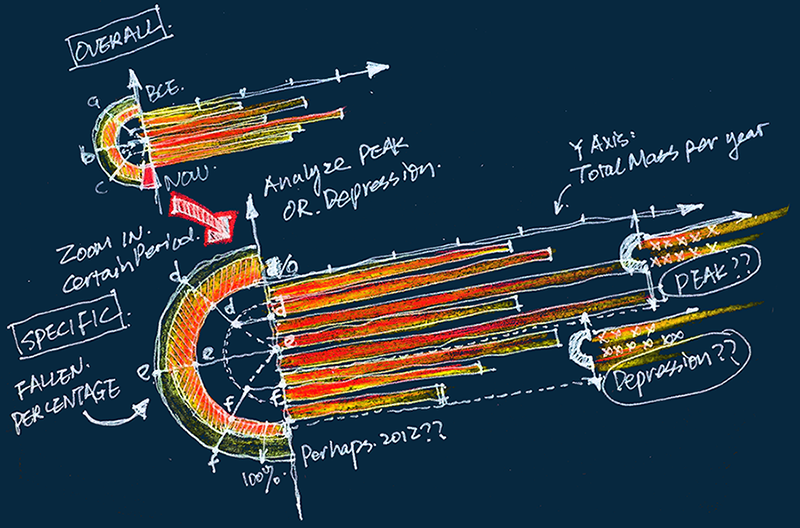
With a noticeable peak period between 1800-1966, when calculating the fallen percentage, we divided the timeline into 4 parts (2500 BCE-1000 BCE, 1000 BCE-500 CE, 500CE-1800 CE and 1800 CE-2012 CE), with an emphasize of analyzing the last part.
The two diagrams above were ultimately combined into a shape that resembled a real meteorite: it is composed by the fallen percentages listed alongside the curved timeline, and the bar chart imitating the “lighting tail”.
Finally, an infographic design was created that visualized two parameters using shapes resembling real meteorites to enhance audience immersion.